UNISTAT Excel Add-In
Best-practice statistical data analysis in Microsoft Excel is difficult with existing add-ins and other software tools. UNISTAT is different, adding the power and accuracy of a full-featured statistical package to your existing analysis and visualization workflow.
Using UNISTAT as Excel addin is easy. All you need to do is select a block of data and then select a procedure from the UNISTAT menus. UNISTAT’s procedure dialogues are intuitive to use and you will not feel as if you are dealing with another program.
By default, UNISTAT will create its output in a new Excel worksheet. You will also have the option to send the same output to Word or HTML for the web.
All numeric results from UNISTAT have up to 15-digit precision, though you can choose to display them with only the desired number of digits. This prevents the build-up of rounding errors when output from one procedure is used as input for another procedure.
Statistical analysis in Excel
| 3D Bar Chart | Friedman Two-Way ANOVA | Multinomial Regression | Multiple Comparisons |
Reliability Analysis
|
| 3D Histogram | Gauge R&R Analysis | Multiple Comparisons | Multiple Discriminant Analysis | Ribbon Chart |
| Analysis of Variance | General Linear Model | Multiple Discriminant Analysis | Multisample Median Test |
Sample Size & Power: ANOVA
|
| Area Chart | Heterogeneity of Regression | Multisample Median Test | Neumann Trend Test |
Sample Size & Power: Correlation
|
| ARIMA | Hierarchical Cluster Analysis | Neumann Trend Test | Nonlinear Regression |
Sample Size & Power: One Sample
|
| Attribute Control Charts | High-Low-Close Chart | Nonlinear Regression | Normal Probability Plot |
Sample Size & Power: Phi Distribution
|
| Bar Chart | Histogram | Normal Probability Plot | Normality Tests |
Sample Size & Power: Two Correlations
|
| Binomial Proportion | Holt’s Linear Forecasting | Normality Tests | Outlier Tests |
Sample Size & Power: Two Proportions
|
| Bland-Altman Plot | Homogeneity of Variance Tests | Outlier Tests | Page’s L Trend |
Sample Size & Power: Two Samples
|
| Box-Cox Regression | Hotelling’s T2 Analysis | Page’s L Trend | Paired Proportions |
Sample Size & Power: Variance
|
| Box-Whisker, Dot and Bar Plots | Hotelling’s T2 Test | Paired Proportions | Paired Samples |
Sample Statistics
|
| Break-Down | Icon Plots | Paired Samples | Parallel Line Method | Scatter Diagram |
| Brown’s Exponential Forecasting | Intraclass Correlation Coefficients | Parallel Line Method | Parametric Tests Matrix |
Sequence Diagram
|
| Canonical Correlations | Inverse Fourier Transform | Parametric Tests Matrix | Pareto Chart |
Slope Ratio Method
|
| Chi-square Tests | Jonckheere’s Trend | Pareto Chart | Partial Correlation Matrix |
Spectral Diagram
|
| Cochran’s Q | K-Means Cluster Analysis | Partial Correlation Matrix | Pearson-Spearman-Kendall Matrix |
Stem and Leaf Plot
|
| Combination of Assays | K-th Neighbour Cluster Analysis | Pearson-Spearman-Kendall Matrix | Pie Chart |
Stepwise Regression
|
| Confidence Intervals | K-th Neighbour Discriminant Analysis | Pie Chart | Plot & Roots of Polynomials |
Summary Statistics
|
| Contingency Table | Kaplan-Meier Analysis | Plot & Roots of Polynomials | Plot of 2D Functions |
Survival Comparison Statistics
|
| Correlation Coefficients | Kappa Test Inter-Category | Plot of 2D Functions | Plot of 3D Functions | t- and F-Tests |
| Cox Regression | Kappa Test Inter-Observer | Plot of 3D Functions | Plot of Distribution Functions | Table of Means |
| Critical Value | Kendall’s Concordance Coeff | Plot of Distribution Functions | Poisson Regression |
Unpaired Proportions
|
| Cross-Tabulation | Kolmogorov-Smirnov Tests | Poisson Regression | Polar Plot |
Unpaired Samples
|
| Cumulative Probability | Kruskal-Wallis One-Way ANOVA | Polar Plot | Polynomial Regression |
Variable Control Charts
|
| Cylinder-Plate 5+1 Assay | Ladder Plot | Polynomial Regression | Principal Components | Weibull Analysis |
| Data Transformation | Life Table | Principal Components | Probabilities and Critical Values |
Winters’ Additive Seasonal Forecasting
|
| Equivalence Test for Means | Linear Regression | Probabilities and Critical Values | Process Capability Analysis |
Winters’ Multiplicative Seasonal Forecasting
|
| Expected Frequencies | Logistic Regression | Process Capability Analysis | Quade Two-Way ANOVA | X-Y Plots |
| Factor Analysis | Logit / Probit / Gompit | Quade Two-Way ANOVA | Quantal Response Method | X-Y-Z Grid Plot |
| Fan Grid Plot | Matrix Plot | Quantal Response Method | Quantiles |
X-Y-Z Scatter Plot
|
| Four-Parameter Logistic Regression | Matrix Statistics | Meta Analysis | Random Numbers | X-Y-Z Spin Plot |
| Fourier Transform | Meta Analysis | Multidimensional Scaling |
Rectangular Plot
|
|
| Frequency Distributions | Multidimensional Scaling | Multinomial Regression |
Regression with Replicates
|
UNISTAT Stand-Alone
The main advantages of using UNISTAT in stand-alone mode (i.e. when running independently of Excel) are:
- it does not have the data size restrictions of Excel,
- has advanced data export / import options that are not available in Excel,
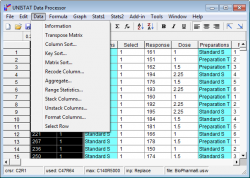
- its built-in spreadsheet (Data Processor) provides efficient data handling procedures like:
- Aggregate: compresses large data sets according to the levels of a factor variable
- Recode: assigns new values to the specified value ranges of a variable
- Stack: stacks blocks of data columns and creates an additional factor variable to keep track
- Unstack: separates blocks of data according to the levels of a factor variable
and specialised statistical functions like:
- Rank: computes ranks with ties
- MdRk: computes exact median ranks using the binomial function
- Freq: creates two new variables containing levels and frequencies of a factor variable
- Level: generates a balanced factor variable
- Dummy: generates n dummy variables for a factor variable with n levels
Spreadsheet
 UNISTAT comes complete with a fully-featured Excel-like spreadsheet specialised for statistical data handling.
Data Processor can cater for different types of data such as numeric, date and time, short and long strings, missing and no-data codes.
In stand-alone mode UNISTAT has practically no limitations on the size of data files. You can handle files with millions of cases and thousands of variables. The only limiting factor is the PC’s memory. In Excel add-in mode the data capacity is limited only by Excel. The data capacity of Light Edition is limited by 50 columns and 1500 rows.
|
| Advanced Data Export / Import
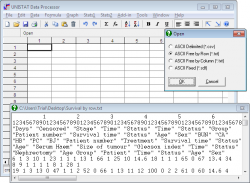
Files can be opened, merged or saved in Excel, Access, CSV and a wide range of text file formats.
In addition to the commonly used delimited text (CSV) file format, UNISTAT’s Data Processor supports ASCII by row (or by case, where the first cases of all variables are read first and then the second cases of all variables, etc.) and ASCII by column (or by variable, where all cases in the first variable are read first and then all cases in the second variable, etc.). For further information see User’s Guide section 3.1.0.5. Free Format ASCII Files.
|
| ODBC and SQL
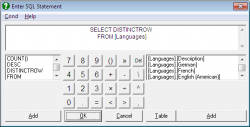
It is possible to open any database for which drivers are installed in the Windows system. It is also possible to execute SQL statements to extract subsets from large databases.
The SQL dialogue allows construction of SQL statements to select a subsample of fields and cases from a database.
|
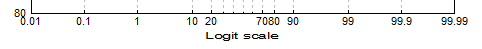
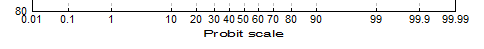
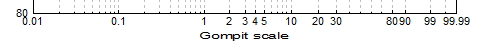
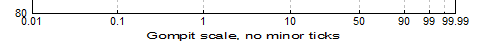
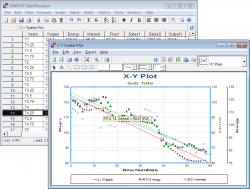
UNISTAT Graphics Engine
Axis Scaling Options


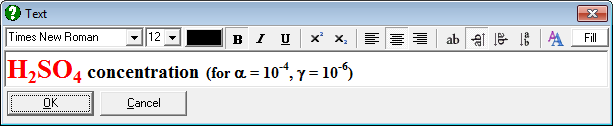
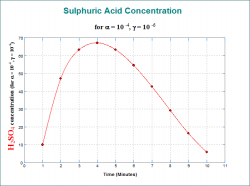
| Text Formatting
It is possible to mix different fonts and sub / superscripts in any text object.
You can copy and paste formatted text between UNISTAT text objects and Microsoft Word or other Windows applications.
Titles can be displayed at 0º, 90º, 270º rotations.
|
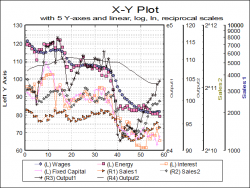
| Multiple Y-Axes
Up to five y-axes can be displayed; one on the left and four on the right, allowing representation of diverse data sets on the same graph.
Each axis can be individually controlled with all available scaling options.
|
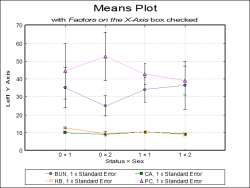
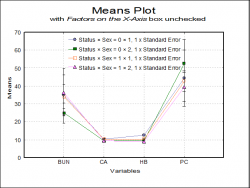
| Means Plot
X-Y Plots, Polar Plot, Bar Chart, Area Chart and Ribbon Chart procedures allow plotting the means of the data series with optional error bars. Error bar options include t- and Z-interval (at any confidence level), standard error and standard deviation (with user-defined multipliers) and variance. For further information see User’s Guide Section Means Plot.
It is also possible to select a continuous variable for the X-Axis, where one or more Y-Axis variables have multiple values corresponding to the same X-Axis variable value. A typical case is the dose-response plot where there are several response variable values for each dose level.
|
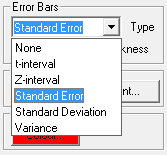
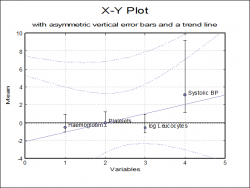
| Error Bars
In addition to the error bar options for means plot, you can define any variable to be displayed as error bars.
This is a powerful feature allowing vertical / horizontal, symmetric / asymmetric error bars for each data point on 2D and 3D scatter plots, bar, area and ribbon charts. For further information see User’s Guide Section Error Bars.
|
| Trend Lines
You can display a line of best fit (linear least squares) for each data series separately.
Confidence interval curves for the mean of Y and / or actual Y values can be drawn at any confidence level.
When only one variable is plotted, it is also possible to fit another curve on the series.
|
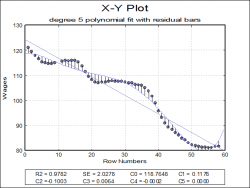
| Curve Fitting
Five different types of curves can be fitted on a bivariate plot, Neville, rational, polynomial, exponential and geometric.
R-squared and standard error values and estimated coefficients are displayed in the legend for polynomial, geometric and exponential fits. It is possible to display residual bars on the graph. For further information see User’s Guide Section Curve Fitting.
|
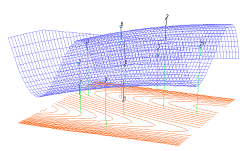
| Surface Fitting
It is possible to fit 3D surfaces, linear regression planes, polynomial and weighted average surfaces on X-Y-Z scatter plots.
Contour lines of the surface can be shown on either or both of the bottom and top planes. Alternatively, a separate 2D contour map can be drawn with extended annotation possibilities. For further information see User’s Guide Section Surface Fitting.
|
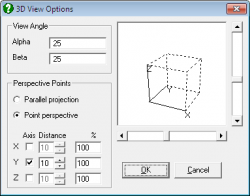
| 3D Options
All 3D graphics procedures allow rotation and selection of the view point, as well as selecting one of parallel, one-point, or three-point perspectives.
The Spin Plot procedure permits the drawing of an X-Y-Z scatter diagram of three variables and rotation of the plot in all directions in real time.
|
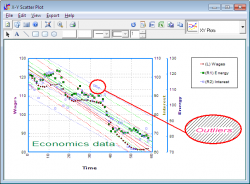
| Interactive Graphics
You can display information about a data point by pressing the and holding the right-mouse button on it. 2D and 3D scatter diagrams, 3D spin, polar, normal probability and regression plots support this feature. In stand-alone mode, the row of the spreadsheet containing the point is also highlighted simultaneously.
In this way, it is easy to determine which points are outliers in the data set. In regression plots, if the <Delete> key is pressed while a point is highlighted, then this point will be omitted and the graph redrawn with a new regression equation.
|
UNISTAT Reporting Results
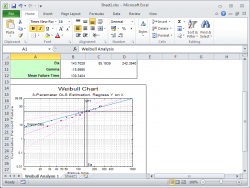
| Output to Excel
When Output to Excel button is clicked, output is sent to a new worksheet in the active workbook. Output is formatted in the form of Excel tables directly within Excel and the graphics are in scaleable enhanced metafile format. You can edit the Excel styles created by UNISTAT to change colours and fonts.
All numeric results from UNISTAT have the full 15-digit precision, though you can choose to display them with only the desired number of digits. This prevents the build-up of rounding errors when output from one procedure is used as input for another procedure.
|
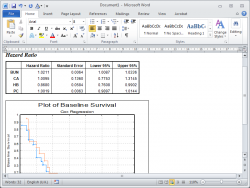
| Output to Word
UNISTAT does not simply send the old style line printer output to Word. Instead, it re-formats its output fully utilising the specific formatting capabilities of Word. When the Output to Word button is clicked, UNISTAT will format its tables directly within Word, in the form of Word tables.
Output is sent to the current document in Word, at the current cursor position. The graphics are in scaleable enhanced metafile format.
You can change the number of digits displayed for numbers from UNISTAT’s Tools / Options dialogue.
|
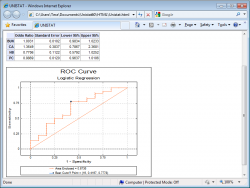
| Output to the Web
Output is sent to the default web browser in the form of HTML tables and PNG format bitmap images.
The output is styled using CSS, allowing easy integration into web sites, wikis, blogs and other web-based applications.
|
| UNISTAT Output Window
In stand-alone mode, by default, all output is sent to UNISTAT’s own Output Window. All text output is created in old style line printer format and displayed with a fixed-width font.
The graphic output is sent to this window in the form of an enhanced metafile object. The Output Window offers all the functionality of WordPad.
|
UNISTAT Product Comparison Table
| FEATURES | Light Edition | Standard Edition | Standard Edition + Bioassays Module |
|---|---|---|---|
| Data Capacity | 50 x 1500 | * unlimited | * unlimited |
| Modes of Running UNISTAT |  |
|
|
| Stand-Alone Mode | |
|
|
| Excel Add-In Mode | |
|
|
| Developer SDK | |
|
|
| Variable Options | |
|
|
| Categorical Data Analysis | |
|
|
| Multiple Dependent Variables | |
|
|
| Creating Interaction Dummy and Lag/Lead Variables | |
|
|
| Output Medium | |
|
|
| UNISTAT Output Window | |
|
|
| Output to Word | |
|
|
| Output to Excel | |
|
|
| Output to Web Browser | |
|
|
| Macros | |
|
|
| Recording Macros | |
|
|
| Running Macros | |
|
|
| Combining Macros | |
|
|
| Macro Shortcut Buttons | |
|
|
| Log File | |
|
|
| Help | |
|
|
| DATA PROCESSOR | |||
| Spreadsheet Functions | |
|
|
| Information | |
|
|
| Transpose Matrix | |
|
|
| Column Sort | |
|
|
| Key Sort | |
|
|
| Matrix Sort | |
|
|
| Recode Column | |
|
|
| Aggregate | |
|
|
| Range Statistics | |
|
|
| Stack Columns | |
|
|
| Unstack Columns | |
|
|
| Format Columns | |
|
|
| Select Row | |
|
|
| Formula | |
|
|
| Mathematical Operators and Functions | |
|
|
| Trigonometric Functions 1 | |
|
|
| Trigonometric Functions 2 | |
|
|
| Scalar Functions | |
|
|
| Statistical Functions | |
|
|
| Special Functions | |
|
|
| Data Conversion Functions | |
|
|
| Date and Time Functions | |
|
|
| UNISTAT Functions | |
|
|
| Conditional Functions | |
|
|
| Constants | |
|
|
| DATA AND FUNCTION PLOTS | |||
| 2D Plots | |
|
|
| X-Y Plots | |
|
|
| Data Series | |
|
|
| Line | |
|
|
| Symbols | |
|
|
| Error Bars | |
|
|
| Point Labels | |
|
|
| Right Y-Axes | |
|
|
| Area Enclosed | |
|
|
| Curve Fitting | |
|
|
| Means Plot | |
|
|
| Polar Plot | |
|
|
| Spectral Diagram | |
|
|
| Fan Grid Plot | |
|
|
| 3D Plots | |
|
|
| X-Y-Z Scatter Plot | |
|
|
| Viewpoint | |
|
|
| Contours | |
|
|
| X-Y-Z Points | |
|
|
| Planes | |
|
|
| Surface Fitting | |
|
|
| X-Y-Z Grid Plot | |
|
|
| Spin Plot | |
|
|
| Charts | |
|
|
| Pie Chart | |
|
|
| Bar Chart | |
|
|
| Area Chart | |
|
|
| Ribbon Chart | |
|
|
| 3D Bar Chart | |
|
|
| High-Low-Close Chart | |
|
|
| Plot of Functions | |
|
|
| Plot of 2D Functions | |
|
|
| Plot of 3D Functions | |
|
|
| Plot and Roots of Polynomials | |
|
|
| Plot of Distribution Functions | |
|
|
| DESCRIPTIVE STATISTICS AND DISTRIBUTIONS | |||
| Descriptive Statistics | |
|
|
| Summary Statistics | |
|
|
| Confidence Intervals | |
|
|
| Quantiles (Percentiles) | |
|
|
| Sample Statistics | |
|
|
| Frequency Distributions | |
|
|
| Stem and Leaf Plot | |
|
|
| Sequence Diagram | |
|
|
| Scatter Diagram | |
|
|
| Distribution Functions | |
|
|
| Cumulative Probability | |
|
|
| Critical Value | |
|
|
| Probabilities and Critical Values | |
|
|
| Random Numbers | |
|
|
| Expected Frequencies | |
|
|
| Descriptive Plots | |
|
|
| Box-Whisker, Dot and Bar Plots | |
|
|
| Box and Whisker Plot | |
|
|
| Dot Plot | |
|
|
| Error Bar Plot | |
|
|
| Normal Probability Plot | |
|
|
| Histogram | |
|
|
| 3D Histogram | |
|
|
| Bland-Altman Plot | |
|
|
| Ladder Plot | |
|
|
| STATISTICAL TESTS CORRELATIONS AND TABLES | |||
| Parametric Tests | |
|
|
| t- and F-Tests | |
|
|
| One Sample t-Test | |
|
|
| Pooled Variance t-Test | |
|
|
| Separate Variance t-Test | |
|
|
| Paired t-Test | |
|
|
| F-Test | |
|
|
| Levene’s F-Test | |
|
|
| Equivalence Test for Means | |
|
|
| Parametric Tests Matrix | |
|
|
| Hotelling’s T-Squared Test | |
|
|
| Correlations | |
|
|
| Correlation Coefficients | |
|
|
| Pearson Product Moment Correlation | |
|
|
| Spearman’s Rank Correlation | |
|
|
| Kendall’s Rank Correlation | |
|
|
| Point Biserial Correlation | |
|
|
| Pearson-Spearman-Kendall Correlations Matrix | |
|
|
| Partial Correlation Matrix | |
|
|
| Intraclass Correlation Coefficients | |
|
|
| Goodness of Fit Tests | |
|
|
| Chi-Square Tests | |
|
|
| One Sample Chi-Square Test | |
|
|
| Two Sample Chi-Square Test | |
|
|
| Kolmogorov-Smirnov Tests | |
|
|
| One Sample Kolmogorov-Smirnov Test: Uniform Distribution | |
|
|
| One Sample Kolmogorov-Smirnov Test: Normal Distribution | |
|
|
| Two Sample Kolmogorov-Smirnov Test | |
|
|
| Normality Tests | |
|
|
| Shapiro-Wilk Test | |
|
|
| Kolmogorov-Smirnov Test | |
|
|
| Cramer-von Mises Test | |
|
|
| Anderson-Darling Test | |
|
|
| Outlier Tests | |
|
|
| Dixon | |
|
|
| Grubbs | |
|
|
| ESD Generalised Extreme Studentised Deviate | |
|
|
| Nonparametric Tests with One or Two Samples | |
|
|
| Unpaired Samples | |
|
|
| Mann-Whitney U Test | |
|
|
| Hodges-Lehmann Estimator (Unpaired) | |
|
|
| Wald-Wolfowitz Runs Test | |
|
|
| Moses Extreme Reaction Test | |
|
|
| Two Sample Median Test | |
|
|
| Paired Samples | |
|
|
| Wilcoxon Signed Rank Test | |
|
|
| Hodges-Lehmann Estimator (Paired) | |
|
|
| Sign Test | |
|
|
| Table of Ranks | |
|
|
| Binomial Proportion | |
|
|
| Runs Test | |
|
|
| Binomial Test | |
|
|
| Noninferiority Test | |
|
|
| Superiority Test | |
|
|
| Equivalence Test for Binomial Proportion | |
|
|
| Unpaired Proportions | |
|
|
| Difference Between Unpaired Proportions | |
|
|
| Risk Ratio | |
|
|
| Odds Ratio and Relative Risks | |
|
|
| Paired Proportions | |
|
|
| Difference Between Paired Proportions | |
|
|
| Fisher’s Exact Test | |
|
|
| McNemar Test | |
|
|
| Odds Ratio (Paired) | |
|
|
| Tetrachoric Correlation | |
|
|
| Multisample Nonparametric Tests | |
|
|
| Kruskal-Wallis One-Way ANOVA | |
|
|
| Kruskal-Wallis ANOVA Test Results | |
|
|
| Kruskal-Wallis ANOVA Multiple Comparisons | |
|
|
| Jonckheere’s Trend | |
|
|
| Multisample Median Test | |
|
|
| Multisample Median Test Results | |
|
|
| Median Multiple Comparisons | |
|
|
| Friedman Two-Way ANOVA | |
|
|
| Friedman ANOVA Test Results | |
|
|
| Friedman ANOVA Multiple Comparisons | |
|
|
| Quade Two-Way ANOVA | |
|
|
| Quade ANOVA Test Results | |
|
|
| Quade ANOVA Multiple Comparisons | |
|
|
| Kendall’s Concordance Coefficient | |
|
|
| Page’s L Trend | |
|
|
| Cochran’s Q | |
|
|
| Kappa Test for Inter-Category Variation | |
|
|
| Kappa Test for Inter-Observer Variation | |
|
|
| Tables | |
|
|
| Contingency Table | |
|
|
| Cross-Tabulation | |
|
|
| Scores | |
|
|
| Tables | |
|
|
| R x C Table Statistics | |
|
|
| Chi-square Tests | |
|
|
| Fisher’s Exact Test | |
|
|
| Measures of Association | |
|
|
| Cochran-Armitage Trend Test | |
|
|
| Cohen’s Kappa | |
|
|
| 2 x 2 Table Statistics | |
|
|
| Stratified Analysis | |
|
|
| Conditional Independence | |
|
|
| Common Odds Ratio and Relative Risks | |
|
|
| Homogeneity of Odds Ratio | |
|
|
| Break-Down | |
|
|
| Sample Size and Power Estimation | |
|
|
| One Sample | |
|
|
| Sample Size in Estimating the Population Mean | |
|
|
| Sample Size in Tests Concerning the Mean | |
|
|
| Minimum Detectable Difference for One Sample | |
|
|
| Power of the Test for One Sample | |
|
|
| Two Samples | |
|
|
| Sample Size in Estimating Two Population Means | |
|
|
| Sample Size in Tests Concerning Two Means | |
|
|
| Minimum Detectable Difference for Two Samples | |
|
|
| Power of the Test for Two Samples | |
|
|
| Variance | |
|
|
| Sample Size for Variance | |
|
|
| Power of the Test for Variance | |
|
|
| Correlation | |
|
|
| Sample Size for Correlation | |
|
|
| Power of the Test for Correlation | |
|
|
| Two Correlations | |
|
|
| Sample Size for Two Correlations | |
|
|
| Power of the Test for Two Correlations | |
|
|
| Two Proportions | |
|
|
| Sample Size for Two Proportions | |
|
|
| Power of the Test for Two Proportions | |
|
|
| ANOVA | |
|
|
| Sample Size for ANOVA | |
|
|
| Maximum Number of Groups for ANOVA | |
|
|
| Minimum Detectable Difference for ANOVA | |
|
|
| Power of the Test for ANOVA | |
|
|
| Phi Distribution | |
|
|
| Inverse Phi Distribution | |
|
|
| Meta Analysis | |
|
|
| REGRESSION AND ANALYSIS OF VARIANCE | |||
| Matrix Statistics | |
|
|
| Regression Analysis | |
|
|
| Linear Regression | |
|
|
| Polynomial Regression | |
|
|
| Stepwise Regression | |
|
|
| Nonlinear Regression | |
|
|
| Logit / Probit / Gompit / Loglog | |
|
|
| Logistic Regression | |
|
|
| Multinomial Regression | |
|
|
| Poisson Regression | |
|
|
| Box-Cox Regression | |
|
|
| Analysis of Variance and General Linear Model | |
|
|
| Analysis of Variance | |
|
|
| General Linear Model | |
|
|
| Randomised Block Designs | |
|
|
| Repeated Measures Designs | |
|
|
| Repeated Measures over all Factors | |
|
|
| Repeated Measures over some Factors | |
|
|
| Latin Squares Designs | |
|
|
| Graeco Latin Squares Designs | |
|
|
| Split-Plot Designs | |
|
|
| Nested Designs | |
|
|
| Crossover Designs | |
|
|
| Tests for ANOVA | |
|
|
| Table of Means | |
|
|
| Homogeneity of Variance Tests | |
|
|
| Multiple Comparisons | |
|
|
| Student-Newman-Keuls | |
|
|
| Tukey-HSD | |
|
|
| Tukey-B | |
|
|
| Duncan | |
|
|
| Scheffe | |
|
|
| Least Significant Difference (LSD) | |
|
|
| Bonferroni (Modified LSD) | |
|
|
| Dunnett | |
|
|
| Regression with Replicates | |
|
|
| Heterogeneity of Regression | |
|
|
| MULTIVARIATE ANALYSIS | |||
| Cluster Analysis | |
|
|
| Hierarchical Cluster Analyses | |
|
|
| Distance Measures | |
|
|
| Distance Matrix | |
|
|
| Hierarchical Methods | |
|
|
| K-th Neighbour Cluster Analysis | |
|
|
| K-Means Cluster Analysis | |
|
|
| Discriminant Analysis | |
|
|
| Multiple Discriminant Analysis | |
|
|
| Stepwise Discriminant Analysis | |
|
|
| Linear Discriminant Analysis | |
|
|
| Canonical Discriminant Analysis | |
|
|
| K-th Neighbour Discriminant Analysis | |
|
|
| Multidimensional Scaling | |
|
|
| Classical Multidimensional Scaling | |
|
|
| Ordinal Multidimensional Scaling | |
|
|
| Principal Components Analysis | |
|
|
| Factor Analysis | |
|
|
| Factoring Methods | |
|
|
| Rotations | |
|
|
| Canonical Correlations | |
|
|
| Reliability Analysis | |
|
|
| Multivariate Plots | |
|
|
| X-Y Matrix Plot | |
|
|
| X-Y Rectangular Plot | |
|
|
| Icon Plots | |
|
|
| TIME SERIES ANALYSIS | |||
| Box-Jenkins ARIMA | |
|
|
| Differencing Input Options | |
|
|
| Differencing Output Options | |
|
|
| Model Fitting | |
|
|
| Seasonal and Nonseasonal Operators | |
|
|
| Model Fitting Parameters | |
|
|
| Model Output Options | |
|
|
| Forecasting | |
|
|
| Forecasting and Smoothing | |
|
|
| Exponential Weights Moving Average | |
|
|
| Brown’s Exponential | |
|
|
| Holt’s Linear | |
|
|
| Winter’s Additive Seasonal | |
|
|
| Winter’s Multiplicative Seasonal | |
|
|
| Neumann Trend Test | |
|
|
| Quality Control | |
|
|
| Operating Characteristic Curve | |
|
|
| Variable Control Charts | |
|
|
| R Chart | |
|
|
| S Chart | |
|
|
| Variance Chart | |
|
|
| X Bar Chart | |
|
|
| Moving Average Charts | |
|
|
| Standard Moving Average Charts | |
|
|
| Exponential Weights Moving Average Chart | |
|
|
| CUSUM Chart | |
|
|
| Table of Values | |
|
|
| X Chart (Levey-Jennings) | |
|
|
| Attribute Control Charts | |
|
|
| C Chart | |
|
|
| U Chart | |
|
|
| Np Chart | |
|
|
| P Chart | |
|
|
| Pareto Chart | |
|
|
| Hotelling’s T-Squared Analysis | |
|
|
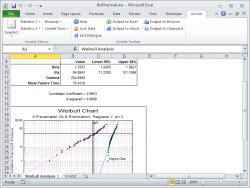
| Weibull Analysis | |
|
|
| Two-Parameter Maximum Likelihood Estimation | |
|
|
| Two-Parameter OLS Estimation | |
|
|
| Three-Parameter OLS Estimation | |
|
|
| Process Capability Analysis | |
|
|
| Performance | |
|
|
| Capability Indices with Overall Standard Deviation | |
|
|
| Capability Indices with Pooled Standard Deviation | |
|
|
| Nonparametric Capability Indices | |
|
|
| Capability Histogram | |
|
|
| Data Transformation | |
|
|
| Johnson Transformation | |
|
|
| Box-Cox Transformation | |
|
|
| Gauge / Gage R&R Analysis | |
|
|
| Gage R&R Average and Range Method | |
|
|
| Gage R&R ANOVA Method | |
|
|
| Gage R&R Charts | |
|
|
| Survival Analysis | |
|
|
| Survival Analysis Variable Selection | |
|
|
| Life Table | |
|
|
| Kaplan-Meier Analysis | |
|
|
| Product Limit Survival Table | |
|
|
| Quantiles of Survival Function | |
|
|
| Kaplan-Meier Plots | |
|
|
| Survival Comparison Statistics | |
|
|
| Wilcoxon Tests: Gehan (Lee Desu) Breslow | |
|
|
| Logrank Test: Mantel-Haenszel (Peto) | |
|
|
| Cox Regression | |
|
|
| Fourier Analysis | |
|
|
| Fourier Transform | |
|
|
| Inverse Fourier Transform | |
|
|
| ANALYSIS OF BIOASSAYS | |||
| Parallel Line Method | |
||
| Validity of Data | |
||
| Summary Statistics | |
||
| Normality Tests | |
||
| Homogeneity of Variance Tests | |
||
| Outlier Tests | |
||
| Box-Whisker, Dot and Bar Plots | |
||
| Normality Plots | |
||
| Validity of Assay | |
||
| Completely Randomised Design | |
||
| Randomised Block Design | |
||
| Latin Squares Design | |
||
| Twin Crossover Design | |
||
| Triple Crossover Design | |
||
| Regression | |
||
| Comparison of Slopes | |
||
| Potency | |
||
| Plot of Treatment Means | |
||
| Slope Ratio Method | |
||
| Validity of Data | |
||
| Validity of Assay | |
||
| Regression | |
||
| Potency | |
||
| Plot of Treatments | |
||
| Quantal Response Method | |
||
| Regression | |
||
| Logit | |
||
| Probit | |
||
| Gompit | |
||
| Loglog | |
||
| Validity of Assay | |
||
| Effective Dose (or Lethal Dose) | |
||
| Potency | |
||
| Plot of Treatments | |
||
| Four-Parameter Logistic Regression | |
||
| 4PL EP | |
||
| Full Model USP | |
||
| Effective Dose | |
||
| Predictions with Confidence and Prediction Intervals | |
||
| Measures of Variability | |
||
| Equivalence Tests | |
||
| Outlier Plot | |
||
| Homogeneity of Variance Plot | |
||
| Dose-Response Plot | |
||
| Reduced Model USP | |
||
| Parallelism Tests | |
||
| Potency | |
||
| Dose-Response Plot | |
||
| Combination of Assays | |
||
| Homogeneity Tests | |
||
| Combined Potency EP | |
||
| Combined Potency USP | |
||
| Plot of Potencies | |
||
| Specific Assays | |
||
| Cylinder-Plate 5+1 Assay | |
||
* unlimited: limited only by available system memory.